• Skip to primary navigation
  • Skip to main content
  • Skip to primary sidebar
Analytic Strategy Partners

Analytic Strategy Partners

Improve your analytic operations and refine your analytic strategy

  • Home
  • Blog
  • Books
  • About
  • Services
  • Contact Us

AI failures

Five Steps to Improve the Analytic Maturity of Your Company – 2021 Edition

December 14, 2020 by Robert Grossman

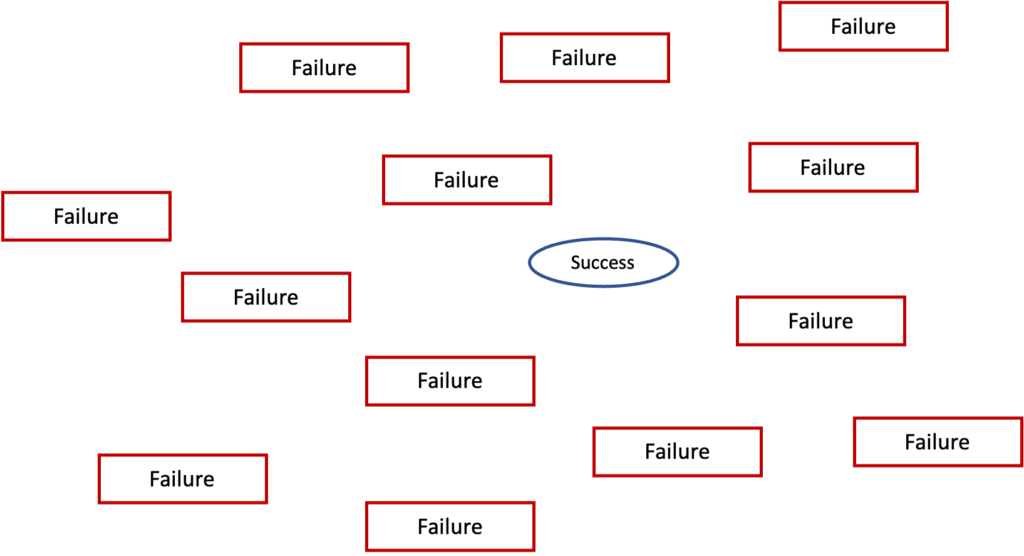
Half of AI Projects Fail

A good rule of thumb is that about half of all AI and analytic projects fail to bring business value. Here are some recent articles that remind us of this:

  • Gil Press writing in Forbes [Press2019] summarized some of the statistics around the failure rate of AI projects. One of the most relevant ones was:”25% of organizations worldwide that are already using AI solutions report up to 50% failure rate; lack of skilled staff and unrealistic expectations were identified as the top reasons for failure [Press2019].”
  • John McCormick writing a column for the Wall Street Journal discusses a Gartner report: “A just-released Gartner Inc. report found that in the last two years, companies with artificial-intelligence experience moved just 53% of their AI proof of concepts into production. A similar survey in 2018 by the research and advisory firm showed that only 47% of AI proof of concepts were fully deployed [McCormick2020].”

Companies that consistently and repeatedly build models, deploy models and extract business value from models generally use processes that share some common characteristics. The role of an analytic maturity model is to identify these processes as a first step to improving them.

Two Dimensions of Analytic Maturity

I have been involved in assessing the analytic maturity of organizations for about twenty years. Based upon this experience, in an (open access) article [Grossman2017], I introduced a framework (call it AMM-17) for evaluating the analytic maturity of an organization that was based on the software maturity capability model [Paulk93].

I have found this framework quite useful and it captures many of the important characteristics of developing analytic and AI models, but it doesn’t address an important difference between developing software (the subject of the capability maturity model) and developing analytic and AI models. In general, for most organizations, software is developed by a single department or division, whereas it is important that analytics be used throughout an organization, wherever that it can add value.

In this post, I’ll remind readers of the AMM-17 model (for more information, see the post “Improving the Analytic Maturity Level of Your Company”). The first four levels (Analytic Maturity Levels D1 – D4) can be best thought of as applying to a single department, center or business unit developing analytic models. In the section that follows, I’ll introduce a second dimension of evaluating the analytic maturity as analytics is replicated throughout an organization (Analytic Maturity Levels E1 – E4).

The Maturity Level of a Project Team, Department or Center to Build and Deploy a Model

The first dimension is the ability of a project, department or analytic center of excellent to build and deploy and analytic model. There are four essential levels of analytic maturity for a department or similar unit, which we call D1 – D4.

D1: Build Reports. An Analytic Maturity Level (AML) D1 organization can analyze data, build reports summarizing the data, and make use of the reports to further the goals of the organization.

D2: Build and Deploy Models. An AML D2 organization can analyze data, build and validate analytic models from the data, and deploy a model into an organization’s products, services, or internal operations.

D3: Use a Repeatable Process to Build and Deploy Models. An AML D3 organization follows a repeatable process for building, deploying and updating analytic models. For most organizations, a repeatable process for building and deploying analytic models usually requires a functioning analytic governance process.

D4: Strategy Driven Repeatable Analytics. A team, no matter how talented, can usually only build a handful of genuinely new analytic models each year. An AML D4 organization has an analytic strategy, aligns the analytic strategy with the organizational strategy, and develops and deploys the models as prioritized by the analytic strategy.

Of course, with the appropriate automation, any given model or category of model can be built many times, but when something new is required, it takes a team, and this is usually what is in short supply. With a analytic maturity level of D4, the effort of the team is spent on the right models, that is, the models that bring the most value to the organization. In other words, the choice of which models to build is driven by an strategy that is congruent with the organizational strategy.

These four levels are the same first four levels in the AMM-17 model described in my earlier post.

Analytic Maturity Levels for Enterprise-Scale Analytics

As companies grow in size, it is critical that analytic be replicated in any department, center of division that it can add value.

E1: Enterprise support. In AML E1 organization, IT support for analytic efforts, so that analytic projects get the data they need, get the computing infrastructure they need, and the support they need to deploy the models that they build?

E2: Replicate. An AML E2 organization replicates analytics throughout the organization, across the departments/divisions that can benefit from it. Different departments/divisions have the support they need from enterprise IT services

E3: Effective analytics governance to coordinate. An AML E3 organization has enterprise analytic services supporting different analytic projects, efforts and groups that provide enterprise data and services when required, while providing the support, flexibility and autonomy each effort requires to move at an optimal velocity. An AML E3 organization has services for enterprise data and metadata that provide a uniform level of integrity for the data, models, and scores across the enterprise.

E4: Holistic management and integration of analytics. An AML E4 organization aligns and integrates the analytic models used by one unit with those used by another unit. For example, in a company that provides credit, analytic models for customer acquisition are aligned with analytic models for risk determination so that new customers are the right customers and not customers who are likely to default on their payments 18 – 24 months later. As another example, for social media companies, analytic models that rank news items and posts for displaying to users to maintain customer engagement are aligned with analytic models for identifying news items and posts for inappropriate content so that items prioritized for users are consistent with the organizations policies and values.

Five Steps to Improve Your Company’s Analytic Maturity

Here are five basic steps to take to understand and quantify the analytic maturity level of your enterprise.

Step 1. Identify where in the organization analytics is done and evaluate the analytic maturity of each of these efforts (using D1 – D4)

Step 2. Identify the enterprise level of analytic maturity that supports these efforts and harmonizes them (using E1 – E4).

Step 3. Review:

  • the level of IT support for each analytic effort and how it can be improved
  • the effectiveness of analytic governance in helping each of these analytic efforts (vs slowing them down) and how it can be improved.
  • what are analytic opportunities and analytics risks that fall between the cracks of existing efforts and are the responsibility of an enterprise analytics office?

Step 4. Identify one to three new analytic efforts that can provide the most value to the organization as a whole.

Step 5. Identify one to three risks associated with analytics that can provide the greatest harm to the organization as a whole.

Related posts

  • Improving the Analytic Maturity of Your Company
  • Analytic Governance and Why it Matters

References

[Grossman2017] Robert L. Grossman, “A framework for evaluating the analytic maturity of an organization,” International Journal of Information Management, 1 February 2018, Volume 38, Number 1, pages 45-51, available online 22 September 2017 at https://doi.org/10.1016/j.ijinfomgt.2017.08.005 (open access).

[McCormick2020] John McCormick, “AI Project Failure Rates Near 50%, But It Doesn’t Have to Be That Way, Say Experts”, Wall Street Journal, Aug.7,2020, available here.

[Paulk1993] Paulk MC, Curtis B, Chrissis MB, Weber CV. Capability maturity model, version 1.1. IEEE software. 1993 Jul;10(4):18-27.

[Press2019] Gil Press, “This Week In AI Stats: Up To 50% Failure Rate In 25% Of Enterprises Deploying AI,” forbes.com, July 19, 2019, available here.

Filed Under: Uncategorized Tagged With: AI failures, analytic failures, analytic governance, analytic maturity, analytic maturity model, deploy analytic models, deploying AI models, developing AI models, repeatable analytics, repeatable process, software maturity capability model, strategy driven

Five Things Every Senior Executive Should Know About AI and ML (2020 Edition)

January 6, 2020 by Robert Grossman

Some of the key differences between AI, machine learning deep learning.

It is clear that artificial intelligence (AI) and machine learning (ML) are important, but with all the reports and with all the self-proclaimed pundits, it is easy to lose track of what is going on and what is essential.   In this short overview, we go over 5 things that every senior executive should know about AI and ML.  

The first two points discussed below may seem to be contradictory at first, but in fact are not. We will discuss both together, and, as we do, it may be helpful to slightly modify F. Scott Fitzgerald’s remark about holding two opposing ideas in mind as follows: “The test of a first-rate intelligence is the ability to hold two opposing ideas about an issue in your mind at the same time, and still retain the ability to make reasonable judgements about it.”

Here are the first two points:

Point 1. AI and ML is over hyped and a fair amount of what is described as AI and ML today is older technology that has been remarketed as AI.

Point 2. Over the past several years there have been some important advances in AI and ML and there is an argument to be made that “Data is the new oil and AI is the factory.”

Because of 2, it is important to take a new look at how you AI and ML can benefit your organization, if you haven’t done so recently.   Because of 1), doing so can be challenging because of the hype and misinformation that is so rampant.

AI and ML have seen some important advances over the past few years. There are many reasons for this, but perhaps the most important are the following.

Three macro factors behind some of the recent advances in deep learning

  1. There is a lot more data available for machine learning and a lot more of it is labeled with the type of labels that many machine learning algorithms require.  
  2. The underlying computing infrastructure (graphics processing units or GPUs) used by games turned out to be incredibly useful for machine learning, and even more specialized computing infrastructure for machine learning has been developed (for example, tensor processing units or TPUs)
  3. Over the past few years, there have been some nice algorithmic advances developed that leverage a) and b).  These include a ML technique called transfer learning that take a ML model built for one problem and use in a component of a ML model for another problem.

On the other hand, it is just as important to keep in mind that AI is being seriously overhyped.   It is relatively easy to raise venture funding in AI, which creates many companies that will not only not be around in a few years when their venture funding dries up, but aren’t producing much value in the near term, and are only greatly adding to the market clutter in the space.   Last year in 2018, VCs invested a record $9.3B into US-based AI startups.  This is over eight times the $1.1B invested in US-based AI startups five years ago in 2013 [1].

If you lead an organization, start with 2) and keep 1) in mind.  If you lead a business unit that uses AI and ML as one of your enabling technologies, then you need to manage 1) and leverage 2).  

It may be helpful to recall that we have seen this tension between real advances in building analytic models over large data and a hype driven by venture-backed startups twice before during the past 30 years.  Although real advances were made in each period, there was also a hype cycle with most of the efforts not delivering much of lasting value.

  • Hype cycle 1: Data mining and knowledge discovery (1995-2001)
  • Hype cycle 2: Big data and data science (2010-2018)
  • Current hype cycle: AI and machine learning (2016-present)

Point 3. With no new advances, new applications of AI and ML will be developed for some time and will continue to transform business.

There are an increasing number of applications in deep learning that are being developed, due primarily to the following factors.

Five factors that are driving new AI applications

  1. New sources of data, including location information and images from phones and data from the Internet of Things (IoT), operational technology (OT), online-to-offline (O2O), autonomous vehicles, etc.
  2. Easy access to powerful computing infrastructure due to cloud computing infrastructure containing GPU and TPU; as well as on-premise GPU clusters.
  3. The availability of large labeled datasets that are openly shared and readily available both for research and commercial applications.
  4. Powerful software frameworks that support machine learning in general and deep learning in particular.
  5. The unreasonable effectiveness of transfer learning and other algorithmic advances.

Unlike the prior periods of hype mentioned above, the current period has seen large investments in open source frameworks for machine learning and deep learning, including TensorFlow, PyTorch, and Keras.  With the ability to leverage cloud computing containing GPUs and the availability of large labeled datasets, it is much easier than in the past periods to create ML and DL models given the right data.  This is an important difference and one of the main reasons that the number of applications that are able to use ML and AI to provide meaningful performance improvements is significantly higher than in the 1995-2001 cycle and 2010-2018 cycle.

Because of this, we will probably see business and organizations continue to develop new deep learning applications for some time, even if there are no new algorithmic advances.

Point 4. Progress is very uneven.

The next point to keep in mind is that progress is quite uneven. It’s important to know which types of projects are likely to succeed and which ones are likely to fail.  In this section, we describe three tiers of AI and ML projects.  Tier 1 projects are likely to succeed if well executed.  Tier 3 projects are likely to fail.

The most progress has been made in the Tier 1  – image, text and speech (ITS) processing.  This is primarily for the five reasons a)-e) mentioned above, with the most important being the large amounts of labeled data that is available.  Tier 2 applications requires simple judgements.  This tier includes: spam detection, detecting fraudulent transactions, content recommendation and related problems.  Tier 3 applications requires complex judgements.  Examples of applications in this tier include: algorithmic hiring, recidivism prediction, and related applications. A recent study has shown that some algorithm hiring algorithms aren’t much better than random guessing [2]. 

Three Tiers of ML and DL Advances

  1. Image, text and speech (ITS) applications have seen significant improvements.
  2. Applications that require simple judgements have made good, but less dramatic improvements.
  3. Applications that require complex judgements and assessments have not made significant progress and significant progress shouldn’t be counted on in the near term.

Simple judgements are basically ML or other analytic models that produce scores with actions and rules within a well understood business process.  As the judgements become more complex and action framework for actions becomes more complex, bias becomes more important, and distinguishing causality from association becomes more important.   It’s important to note that ML has been used successfully in the second category for some time, including in cycles 1 and 2.  The dramatic advances from the AI deep learning techniques has been largely focused in the first ITS category.

Arvind Narayanan has notes from his talk “How to Recognize AI Snake Oil [3]” that provides another perspective worth understanding in predicting which AI applications are likely to succeed and which are likely to failure. Narayanan distinguishes between three tiers of AI applications that overlap the categories above.  The first category, which he calls perception is more or less the same as the ITS category above.  Narayanan’s second category is automating judgements and his third category is predicting social outcomes.  Recidivism prediction would be in his third category.  His lecture notes [3] describe some of the successes in the first category and some of the snake oil fraud and failures in the third category.

Point 5. Deriving value from AI and ML projects is hard and many projects will fail to deliver any significant business value.

It’s helpful to keep in mind what I call the staircase of failure [4, Chapter 11]: 

  1. Developing software is hard.
  2. Projects that require working with data are usually harder.
  3. Projects that require building and deploying analytic models are usually harder in turn.

If you think of this as a staircase, to deliver value, you must develop a software system, that processes data, uses the data to build models, and uses the models to produce scores that take actions that bring business value.  In other words, you must climb the staircase to the top, which requires not only good technology, but also choosing the right problems, having good (usually labeled) datasets, and most importantly have a good analytic team [4, Chapter 12], a good project structure [4, Chapter 11], and a good way of using the outputs of the models to produce actions that bring business value [4, Chapter 13].

References

[1] CB Insights, The United States Of Artificial Intelligence Startups, November 26, 2019, retrieved from https://www.cbinsights.com/research/artificial-intelligence-startup-us-map/ on December 10, 2020.  Also, see CB Insights, What’s Next in AI? Artificial Intelligence Trends, 2019.

[2] Manish Raghavan, Solon Barocas, Jon Kleinberg, and Karen Levy, Mitigating Bias in Algorithmic Employment Screening: Evaluating Claims and Practices, arXiv preprint arXiv:1906.09208, 2019.

[3] Arvind Narayanan, How to recognize AI snake oil, retrieved from https://www.cs.princeton.edu/~arvindn/talks/MIT-STS-AI-snakeoil.pdf on December 10, 2019

[4] Robert L. Grossman, The Strategy and Practice of Analytics, to appear.

Filed Under: Uncategorized Tagged With: AI, AI failures, data is the new oil, deep learning, hype cycles, machine learning, ML failures

Primary Sidebar

Recent Posts

  • Developing an AI Strategy: Four Points of View
  • Ten Books to Motivate and Jump-Start Your AI Strategy
  • A Rubric for Evaluating New Projects that Produce Data
  • How Does No-Code Impact Your Analytic Strategy?
  • The Different Varieties of Advisors & the Difference it Makes

Recent Comments

    Archives

    • May 2022
    • April 2022
    • March 2022
    • February 2022
    • January 2022
    • December 2021
    • November 2021
    • October 2021
    • September 2021
    • August 2021
    • July 2021
    • June 2021
    • May 2021
    • April 2021
    • March 2021
    • February 2021
    • January 2021
    • December 2020
    • November 2020
    • October 2020
    • September 2020
    • August 2020
    • July 2020
    • June 2020
    • May 2020
    • April 2020
    • March 2020
    • February 2020
    • January 2020
    • December 2019
    • November 2019
    • October 2019
    • September 2019
    • June 2019
    • May 2019
    • September 2018

    Categories

    • Uncategorized

    Meta

    • Log in
    • Entries feed
    • Comments feed
    • WordPress.org

    Copyright © 2025