• Skip to primary navigation
  • Skip to main content
  • Skip to primary sidebar
Analytic Strategy Partners

Analytic Strategy Partners

Improve your analytic operations and refine your analytic strategy

  • Home
  • Blog
  • Books
  • About
  • Services
  • Contact Us

Uncategorized

Five Things Every Senior Executive Should Know About AI and ML (2020 Edition)

January 6, 2020 by Robert Grossman

Some of the key differences between AI, machine learning deep learning.

It is clear that artificial intelligence (AI) and machine learning (ML) are important, but with all the reports and with all the self-proclaimed pundits, it is easy to lose track of what is going on and what is essential.   In this short overview, we go over 5 things that every senior executive should know about AI and ML.  

The first two points discussed below may seem to be contradictory at first, but in fact are not. We will discuss both together, and, as we do, it may be helpful to slightly modify F. Scott Fitzgerald’s remark about holding two opposing ideas in mind as follows: “The test of a first-rate intelligence is the ability to hold two opposing ideas about an issue in your mind at the same time, and still retain the ability to make reasonable judgements about it.”

Here are the first two points:

Point 1. AI and ML is over hyped and a fair amount of what is described as AI and ML today is older technology that has been remarketed as AI.

Point 2. Over the past several years there have been some important advances in AI and ML and there is an argument to be made that “Data is the new oil and AI is the factory.”

Because of 2, it is important to take a new look at how you AI and ML can benefit your organization, if you haven’t done so recently.   Because of 1), doing so can be challenging because of the hype and misinformation that is so rampant.

AI and ML have seen some important advances over the past few years. There are many reasons for this, but perhaps the most important are the following.

Three macro factors behind some of the recent advances in deep learning

  1. There is a lot more data available for machine learning and a lot more of it is labeled with the type of labels that many machine learning algorithms require.  
  2. The underlying computing infrastructure (graphics processing units or GPUs) used by games turned out to be incredibly useful for machine learning, and even more specialized computing infrastructure for machine learning has been developed (for example, tensor processing units or TPUs)
  3. Over the past few years, there have been some nice algorithmic advances developed that leverage a) and b).  These include a ML technique called transfer learning that take a ML model built for one problem and use in a component of a ML model for another problem.

On the other hand, it is just as important to keep in mind that AI is being seriously overhyped.   It is relatively easy to raise venture funding in AI, which creates many companies that will not only not be around in a few years when their venture funding dries up, but aren’t producing much value in the near term, and are only greatly adding to the market clutter in the space.   Last year in 2018, VCs invested a record $9.3B into US-based AI startups.  This is over eight times the $1.1B invested in US-based AI startups five years ago in 2013 [1].

If you lead an organization, start with 2) and keep 1) in mind.  If you lead a business unit that uses AI and ML as one of your enabling technologies, then you need to manage 1) and leverage 2).  

It may be helpful to recall that we have seen this tension between real advances in building analytic models over large data and a hype driven by venture-backed startups twice before during the past 30 years.  Although real advances were made in each period, there was also a hype cycle with most of the efforts not delivering much of lasting value.

  • Hype cycle 1: Data mining and knowledge discovery (1995-2001)
  • Hype cycle 2: Big data and data science (2010-2018)
  • Current hype cycle: AI and machine learning (2016-present)

Point 3. With no new advances, new applications of AI and ML will be developed for some time and will continue to transform business.

There are an increasing number of applications in deep learning that are being developed, due primarily to the following factors.

Five factors that are driving new AI applications

  1. New sources of data, including location information and images from phones and data from the Internet of Things (IoT), operational technology (OT), online-to-offline (O2O), autonomous vehicles, etc.
  2. Easy access to powerful computing infrastructure due to cloud computing infrastructure containing GPU and TPU; as well as on-premise GPU clusters.
  3. The availability of large labeled datasets that are openly shared and readily available both for research and commercial applications.
  4. Powerful software frameworks that support machine learning in general and deep learning in particular.
  5. The unreasonable effectiveness of transfer learning and other algorithmic advances.

Unlike the prior periods of hype mentioned above, the current period has seen large investments in open source frameworks for machine learning and deep learning, including TensorFlow, PyTorch, and Keras.  With the ability to leverage cloud computing containing GPUs and the availability of large labeled datasets, it is much easier than in the past periods to create ML and DL models given the right data.  This is an important difference and one of the main reasons that the number of applications that are able to use ML and AI to provide meaningful performance improvements is significantly higher than in the 1995-2001 cycle and 2010-2018 cycle.

Because of this, we will probably see business and organizations continue to develop new deep learning applications for some time, even if there are no new algorithmic advances.

Point 4. Progress is very uneven.

The next point to keep in mind is that progress is quite uneven. It’s important to know which types of projects are likely to succeed and which ones are likely to fail.  In this section, we describe three tiers of AI and ML projects.  Tier 1 projects are likely to succeed if well executed.  Tier 3 projects are likely to fail.

The most progress has been made in the Tier 1  – image, text and speech (ITS) processing.  This is primarily for the five reasons a)-e) mentioned above, with the most important being the large amounts of labeled data that is available.  Tier 2 applications requires simple judgements.  This tier includes: spam detection, detecting fraudulent transactions, content recommendation and related problems.  Tier 3 applications requires complex judgements.  Examples of applications in this tier include: algorithmic hiring, recidivism prediction, and related applications. A recent study has shown that some algorithm hiring algorithms aren’t much better than random guessing [2]. 

Three Tiers of ML and DL Advances

  1. Image, text and speech (ITS) applications have seen significant improvements.
  2. Applications that require simple judgements have made good, but less dramatic improvements.
  3. Applications that require complex judgements and assessments have not made significant progress and significant progress shouldn’t be counted on in the near term.

Simple judgements are basically ML or other analytic models that produce scores with actions and rules within a well understood business process.  As the judgements become more complex and action framework for actions becomes more complex, bias becomes more important, and distinguishing causality from association becomes more important.   It’s important to note that ML has been used successfully in the second category for some time, including in cycles 1 and 2.  The dramatic advances from the AI deep learning techniques has been largely focused in the first ITS category.

Arvind Narayanan has notes from his talk “How to Recognize AI Snake Oil [3]” that provides another perspective worth understanding in predicting which AI applications are likely to succeed and which are likely to failure. Narayanan distinguishes between three tiers of AI applications that overlap the categories above.  The first category, which he calls perception is more or less the same as the ITS category above.  Narayanan’s second category is automating judgements and his third category is predicting social outcomes.  Recidivism prediction would be in his third category.  His lecture notes [3] describe some of the successes in the first category and some of the snake oil fraud and failures in the third category.

Point 5. Deriving value from AI and ML projects is hard and many projects will fail to deliver any significant business value.

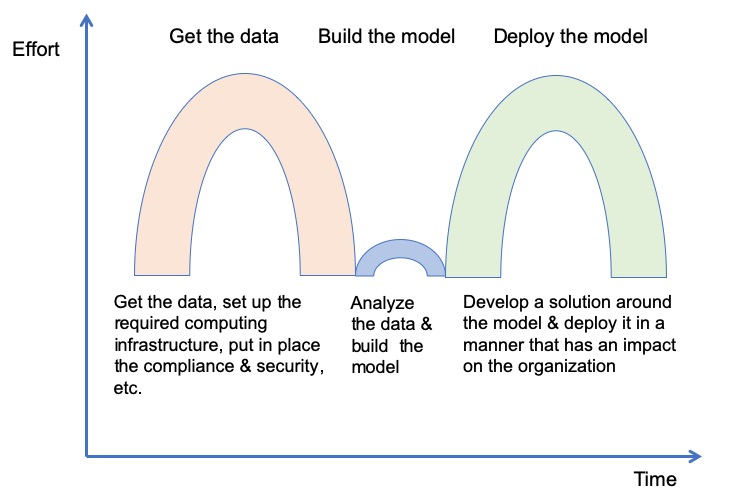
It’s helpful to keep in mind what I call the staircase of failure [4, Chapter 11]: 

  1. Developing software is hard.
  2. Projects that require working with data are usually harder.
  3. Projects that require building and deploying analytic models are usually harder in turn.

If you think of this as a staircase, to deliver value, you must develop a software system, that processes data, uses the data to build models, and uses the models to produce scores that take actions that bring business value.  In other words, you must climb the staircase to the top, which requires not only good technology, but also choosing the right problems, having good (usually labeled) datasets, and most importantly have a good analytic team [4, Chapter 12], a good project structure [4, Chapter 11], and a good way of using the outputs of the models to produce actions that bring business value [4, Chapter 13].

References

[1] CB Insights, The United States Of Artificial Intelligence Startups, November 26, 2019, retrieved from https://www.cbinsights.com/research/artificial-intelligence-startup-us-map/ on December 10, 2020.  Also, see CB Insights, What’s Next in AI? Artificial Intelligence Trends, 2019.

[2] Manish Raghavan, Solon Barocas, Jon Kleinberg, and Karen Levy, Mitigating Bias in Algorithmic Employment Screening: Evaluating Claims and Practices, arXiv preprint arXiv:1906.09208, 2019.

[3] Arvind Narayanan, How to recognize AI snake oil, retrieved from https://www.cs.princeton.edu/~arvindn/talks/MIT-STS-AI-snakeoil.pdf on December 10, 2019

[4] Robert L. Grossman, The Strategy and Practice of Analytics, to appear.

Filed Under: Uncategorized Tagged With: AI, AI failures, data is the new oil, deep learning, hype cycles, machine learning, ML failures

Twelve Rules for a Chief Analytics Officer

December 6, 2019 by Robert Grossman

About the picture: George Heilmeier was the Director of DARPA from 1974-1977, where he developed seven questions that he used to determine whether to fund research projects. The questions became known as Heilmeier’s Catechism and are still used today. The image is from: https://en.wikipedia.org/wiki/George_H._Heilmeier

George Heilmeier (1936-2014) was a engineer and technology executive who started his career working in liquid crystal displays (LCD) at RCA (1958-1970), became a White House Fellow (1970-1971), a senior executive at DOD (1971-1974), the Director of DARPA (1974-1977), a technology executive at Texas Instruments (1977-1991), and the President and CEO of Bell Communications Research Inc. (Bellcore) (1991-1996).

He was elected to the US National Academy of Engineering in 1979, and in addition to other awards and recognitions, he won the 2005 Kyoto Prize for his invention of the liquid crystal display.

While working at DARPA, he came up with a simple set of rules for selecting and managing technology projects that became known as Heilmeier’s Catechism. There are several formulations, including the following list of questions:

Heilmeier’s Catechism

  • What are you trying to do? Articulate your objectives using absolutely no jargon.
  • How is it done today, and what are the limits of current practice?
  • What’s new in your approach and why do you think it will be successful?
  • Who cares? If you’re successful, what difference will it make?
  • What are the risks and the payoffs?
  • How much will it cost? How long will it take?
  • What are the midterm and final “exams” to check for success?

He became the CTO at Texas Instruments and developed a framework for CTOs that is lesser known and consisted of twelve rules. The rules can be found in a December 30, 2009 blog post by Rich DeMillo, who is a Distinguished Professor of Computing and Management at Georgia Tech in Atlanta.

In 2012, I adapted these 12 rules to create 12 rules for Chief Analytic Officers or Chief Data Officers. I used to go over these when I taught a course at the University of Chicago Booth School of Business on the Strategy and Practice of Analytics (2013-2015) . You can learn more about these rules in Chapter 10 (Analytic Governance) of my upcoming book The Strategy and Practice of Analytics. Here are the rules:

Twelve Rules for Chief Analytic Officers (or Chief Data Officers)

  1. For each “client” establish/conceive a list of technologies and initiatives that drive the business and a list of technologies and initiatives that could change the business.
  2. Use the Catechism to get people to focus on essentials when making analytic investment decisions and establishing analytic priorities.
  3. Understand the limits of analytic technologies and capabilities today.
  4. Establish a good working relationship with your peers in marketing, sales, finance, HR, etc.
  5. Align analytic strategy with the real priorities and the strategy of your organization, as understood by your CEO and Chairman.
  6. Establish metrics for the success of your programs in their eyes.
  7. Don’t shy away from doing some near term problem solving and working basic projects in analytics. It builds credibility and respect.
  8. Never have your peers or clients come to your office for meetings with you.  Go to theirs.
  9. It is easy to be arrogant when discussing a technical subject.   But remember, any display of arrogance will cost you.  Don’t do it.
  10. Compile a list of innovations that are needed in big data and analytics by your organization.  How are these the same and how are they different from the innovations required by the broader analytic community.
  11. Make sure that each program or initiative is output oriented not activity oriented.    Output = value to your organization.
  12. Learn your company’s culture.  It is unique.

As mentioned, these are basically Heilmeier’s rules for a CTO, just lightly adapted.

Copyright 2019 Robert L. Grossman

Filed Under: Uncategorized Tagged With: analytic governance, chief analytics officer, chief data officer, Heilmeier Catechism, Heilmeier Rules

Deploying Analytic Models

November 4, 2019 by Robert Grossman

One of my defining experiences in analytics occurred over twenty years ago in 1998. At that time, it was very challenging to build analytic models if the data did not fit into the memory of a single computer. This was the time that clusters of distributed computers (called Beowulf clusters then) were still new and only used in academia, ensembles of models were still largely unknown, and when Python and R were still only used by a few fringe communities. I was working at a venture backed start up that developed software for building trees and other common analytic models over clusters of workstations by using ensembles of models. One of our first customers gave us clean, nicely labeled data just when they said they would (in over twenty years this has only happened a handful of times). We built a model that outperformed what was used in production and I (very) naively thought we were done. Little did I understand just how much work it would be to get the model into production and how much it would have to change to get it there. The figure above gives the general idea, but in practice getting the data and deploying the model is even harder than the figure indicates.

Most analytic and machine learning conferences even today focus on new algorithms and new software but very little on deploying analytic models. An exception is the workshop called “Common Model Infrastructure” which was held at KDD 2018 and ICDM 2019. The workshop describes its focus as “infrastructure for model lifecycle management—to support discovery, sharing, reuse, and reproducibility of machine learning, data mining, and data analytics models.”

I spoke at the CMI 2018 workshop at KDD 2018. My slides are on SlideShare and you can find them here. I singled out the following best practices:

Five Best Practices When Deploying Models

  1. Mature analytic organizations have an environment to automate testing and deployment of analytic models.
  2. Don’t think just about deploying analytic models, but make sure that you have a process for deploying analytic workflows.
  3. Focus not just on reducing Type 1 and Type 2 errors, but also data input errors, data quality errors, software errors, systems errors and human errors. People only remember that model didn’t work, not whose fault it was.
  4. Track value obtained by the deployed analytic model, even if it is not your explicit responsibility.
  5. It is often easier to increase the value of deployed model by improving the pre- and post- processing vs chasing smaller improvements in the model’s lift curve.

During the talk, I identified five common approaches for deploying analytic models. I remember these with the acronym E3RW:

  1. Embed analytics in databases
  2. Export models and deploy them by importing into scoring engines
  3. Encapsulate models using containers or virtual machines
  4. Read a table of values that provide the parameters of the model
  5. Wrap the code, workflow, or analytic system, and, perhaps, create a service

Although these days, with the popularity of continuous integration (CI) and continuous deployment (CD), encapsulating models in containers and using CI/CD tools is the approach du jour, each approach has its place.

I also identified five common mistakes when deploying analytic models.

Five Common Mistakes When Deploying Models

  1. Not understanding all the subtle differences between the supplied run time data used to train the model and the actual run time data the model sees.
  2. Thinking that the features are fixed and all that you will need to do is update the parameters.
  3. Thinking the model is done and not realizing how much work is required to keep up to date all the the pre- and post-processing required.
  4. Not checking in production to see if the inputs to the models drift slowly over time.
  5. Not checking that the model will keep running despite missing values, garbage values, etc. (even values that should never be missing in first place).

Copyright 2019 Robert L. Grossman

Filed Under: Uncategorized Tagged With: analytic operations, common model infrastructure, deploying analytic models, E3RW

Improving the Analytic Maturity Level of Your Company

October 2, 2019 by Robert Grossman

The figure shows the five levels of analytic maturity – Analytic Maturity Level (AML) 1 -5.

Over the past 10 years or so, I developed and used an analytic maturity model that was broadly motivated by the software Capability Maturity Model (CMM) that is used in software development.

You can learn more about the model in this article: A Framework for Evaluating the Analytic Maturity of an Organization, International Journal of Information Management, 2018, which is open access and available here: doi.org/10.1016/j.ijinfomgt.2017.08.005. This article introduces five Analytic Maturity Levels (AML) and discusses the analytic processes required to achieve each level.

Over the past few years I have been working on a book called the Strategy and Practice of Analytics and have been thinking about analytic maturity levels again. Here are the five levels as defined in the book:

AML 1: Build reports. An AML 1 organization can analyze data, build reports summarizing the data, and make use of the reports to further the goals of the organization.

AML 2: Build models. An AML 2 organization can analyze data, build and validate analytic models from the data, and deploy a model.

AML 3: Repeatable analytics. An AML 3 organization follows a repeatable process for building, deploying and updating analytic models. In my experience, a repeatable process usually requires a functioning analytic governance process.

AML 4: Strategy driven repeatable analytics.  An AML 4 has an analytic strategy that aligns with the corporate strategy, uses the analytic strategy for selecting which analytic opportunities to pursue, and follows a repeatable process for building, deploying and updating analytic models.

AML 5: Strategy driven enterprise analytics. An AML 5 organization uses analytics throughout the organization and analytic models in the organization are built with a common infrastructure and process whenever possible, deployed with a common infrastructure and process whenever possible, and the outputs of the analytic models integrated together as required to optimize the goals of the organization as a whole. Analytics across the enterprise are coordinated by an analytic strategy and analytic governance process.

Five ways to improve the analytic maturity level of your organization. Here are five suggestions for improving the analytic maturity level of your organization.

  1. Set up a committee to quantify the analytic maturity of your company. If you cannot measure it, you cannot improve it.
  2. Set up (or improve) the environment for deploying analytic models, using a model interchange format, analytic engines, or similar technology. (Helpful for AM Level 2).
  3. Set up your first analytic governance committee or improve the operational efficiency of your current analytic governance. (Helpful for AM Level 2).
  4. Set up SOPs for building and/or deploying analytic models so that the process is faster, repeatable & replicable. (AM Level 3 Requirement)
  5. Volunteer to lead a process to integrate two different models from two different parts of your company to improve the relevant actions. (Helpful for AM Level 5)

What’s different between AMM-12 and AMM-17? Although the paper describing the analytic maturity model was published in 2017, the work dates back to period 2010-2012. I first gave a talk about the AMM in 2012 at a Predictive Analytic World (PAW) conference that took place on June 25, 2012 in Chicago. Since the AMM didn’t change between 2012 and when it was published in 2017, let’s call this the AMM-2012 model.

In the AMM-2012, AML 1-3 are the same, but AML 4 is Enterprise Analytics and AML 5 is Strategy Driven Analytics. The problem with this approach is that strategy driven analytics can occur at any level, so it is not particularly helpful to reserve it for level 5. From one perspective whether, strategy can be integrated into processes for building reports (AML 1), for building models (AML 2), for building models in a repeatable fashion (AML 4), or for building models across the enterprise in a repeatable fashion (AML 5). With this approach, reports -> models -> repeatable models -> enterprise models would be one axis and the degree of strategy integration would be another axis. This seemed too complicated though for most applications, so for the AML-19 versions of the AMM, AML 4 is simply strategy driven repeatable analytics and AML-5 is strategy driven enterprise analytics.

I speak about analytic maturity models from time to time, most recently at the Predictive Analytics World (PAW) Conference that took place in Chicago on June 29, 2017 and The Data Science Conference Chicago (TDSC) that took place in Chicago on, April 20, 2017. I also occasionally give in house training courses that include material about helping a company increase its analytic maturity level.

You can find more information about Analytic Maturity Models in Chapter 14 of my book The Strategy and Practice of Analytics.

Copyright 2019 Robert L. Grossman

Filed Under: Uncategorized Tagged With: analytic governance, analytic maturity, analytic maturity model, analytic operations, analytic strategy, repeatable analytics

  • « Go to Previous Page
  • Page 1
  • Interim pages omitted …
  • Page 6
  • Page 7
  • Page 8
  • Page 9
  • Go to Next Page »

Primary Sidebar

Recent Posts

  • Developing an AI Strategy: Four Points of View
  • Ten Books to Motivate and Jump-Start Your AI Strategy
  • A Rubric for Evaluating New Projects that Produce Data
  • How Does No-Code Impact Your Analytic Strategy?
  • The Different Varieties of Advisors & the Difference it Makes

Recent Comments

    Archives

    • May 2022
    • April 2022
    • March 2022
    • February 2022
    • January 2022
    • December 2021
    • November 2021
    • October 2021
    • September 2021
    • August 2021
    • July 2021
    • June 2021
    • May 2021
    • April 2021
    • March 2021
    • February 2021
    • January 2021
    • December 2020
    • November 2020
    • October 2020
    • September 2020
    • August 2020
    • July 2020
    • June 2020
    • May 2020
    • April 2020
    • March 2020
    • February 2020
    • January 2020
    • December 2019
    • November 2019
    • October 2019
    • September 2019
    • June 2019
    • May 2019
    • September 2018

    Categories

    • Uncategorized

    Meta

    • Log in
    • Entries feed
    • Comments feed
    • WordPress.org

    Copyright © 2025