• Skip to primary navigation
  • Skip to main content
  • Skip to primary sidebar
Analytic Strategy Partners

Analytic Strategy Partners

Improve your analytic operations and refine your analytic strategy

  • Home
  • Blog
  • Books
  • About
  • Services
  • Contact Us

Uncategorized

Why Do So Many Analytic and AI Projects Fail?

May 11, 2020 by Robert Grossman

“Success teaches us nothing; only failure teaches.”
Admiral Hyman G. Rickover, address to US Naval Postgraduate School, 16 March 1954

Figure 1: Admiral Rickover on the Sculpin nuclear submarine.

The Importance of Understanding Why Analytic Projects Fail

Although many writers have discussed the importance of understanding the reasons for project failures, I choose a quote from Admiral Hyman G. Rickover, the father of the nuclear submarine.  In just a few years, from 1950-1953, not only did he develop a controlled nuclear reactor (nuclear explosions are not controlled and obviously not suitable for powering ships), but he miniaturized it so that it would fit on a submarine, and solved a host of technical problems so that the USS Nautilus submarine became the first submarine to cross the Atlantic without surfacing and without taking on any fuel [1]. Importantly, during Rickover’s command of the nuclear submarine program, there were zero reactor accidents [1].

One of Rickover’s rules was: “You must have a rising standard of quality over time, and well beyond what is required by any minimum standard [1].”  These days we might phrase this as the need for process that continuously improves quality. In analytics and AI, we would apply this process of continuous improvement to ETL, to feature engineering, to model estimation, to refining the actions associated with the model outputs, and to quantifying the business value produced by the model. 

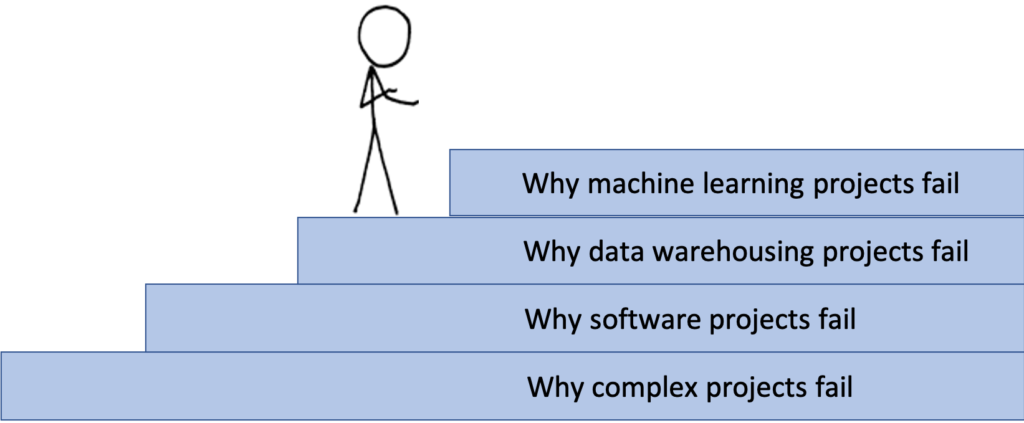
The Staircase of Failure

One way of understanding why so many analytic and AI projects fail is what I call the staircase of failure.  See Figure 1. For a machine learning or AI project to succeed, it must overcome many of the factors that cause many complex projects to fail, that cause many software projects to fail, and that cause many data warehousing projects to fail. I discuss this in Chapter 11 (Managing Analytic Projects) of my upcoming book The Strategy and Practice of Analytics.

Figure 1: The staircase of failure – It is well known that many data warehousing projects fail. While data warehousing projects require that the project team includes people that understand data and understand the customer use cases, even deeper knowledge is required for machine learning projects.

Five Dimensions of Risk

When managing an analytic project, there are five important dimensions of risk to manage [2]:

  1. Data risk
  2. Deployment risk
  3. Technical risk
  4. Team risk
  5. The risk that the model doesn’t produce the minimum viable value (MVV) required

I have talked about two of the biggest risks several times in this blog: data risk and deployment risk. Data risk is the risk that you won’t get the data that you need for the project and deployment risk is that you won’t be able deploy the model and take actions that produce the value needed to make the model successful. The SAM Framework is one way to manage the scores produced by the model, the associated actions that produce value, and measures to track the value produced.

Technical risk is the risk that the project doesn’t have the software or technical expertise required to acquire the data, manage the data, build the models, deploy the models, or support the actions required for the project.

The team risk is the risk that the team doesn’t have the required expertise or leadership to successfully complete the project.

Finally, MVV is the minimum viable value that the analytic model must generate for the project to be successful.

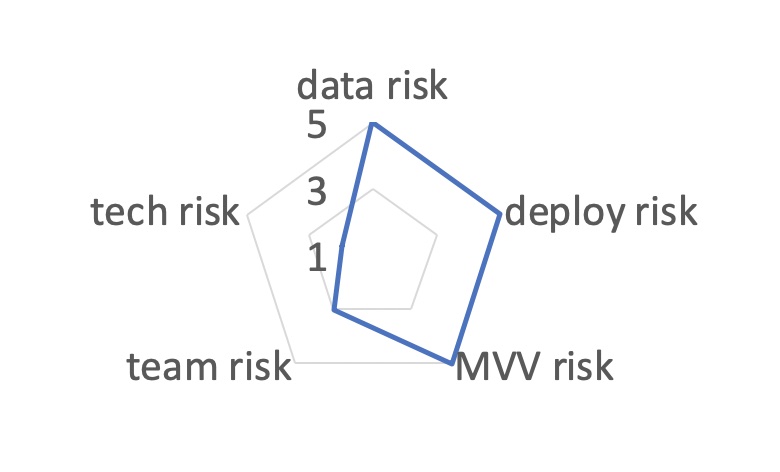
For complex projects, I plot these five dimensions in a radar plot and work to reduce the overall risk of the project along each of the dimensions over time [2]. See Figure 2.

Figure 2: The five dimensions of risk for an analytic or AI project.

I’ll be speaking about managing analytic projects at the upcoming Predictive Analytics World.

Title: Why Do So Many Analytic and AI Projects Fail and What Are Some Frameworks for Improving the Odds of Success?

Event: Predictive Analytics World (PAW), Las Vegas, June 2, 2020 (now a virtual event)

Abstract:  Many analytic models never get the data they need to be successful; many analytic models that do are never deployed successfully into operations; and, many deployed models never bring the value they promised to stakeholders.  In this talk, I give a framework for those leading analytic or AI projects or interested in leading these types of projects in the future that improves the odds for overcoming these and related challenges. 

References

[1] USN (Ret.) Rear Admiral Dave Oliver, Against the Tide: Rickover’s Leadership Principles and the Rise of the Nuclear Navy, Naval Institute Press, 2014.

[2] Robert L. Grossman, The Strategy and Practice of Analytics, Open Data Press, to appear.

Filed Under: Uncategorized Tagged With: AI project failures, analytic project failures, deployment risk, minimum viable value, MVV, project failures, Rickover

Analytic Governance and Why It Matters

April 10, 2020 by Robert Grossman

The figure shows the CDC 6600, which was released in 1962 and viewed by many as the first supercomputer. It was the result of Seymour Cray’s five year plan, which in its entirety read: “Five year goal: Build the biggest computer in the world.”

In 1962, IBM introduce its 7094 mainframe computer, which became the world’s fastest computer.  It was used by NASA for the Gemini and Apollo space programs and by the Air Force for its missile defense systems [1].  IBM was a large company and to build the 7094 required good technical talent, good technical leadership, and good governance.  

A year later in 1963, the Control Data Corporation (CDC), a small company with only 34 people, including the janitor, released the CDC 6600, which is commonly viewed as the world’s first supercomputer [2].  It was designed by Seymour Cray, one of the co-founders of CDC.

The CDC 6600 was much faster than the IBM 7094.  The senior executives at IBM were surprised that such a small company could build such a fast, innovative computer.  At that time, CDC was small enough that no governance was needed. Seymour Cray’s dislike of bureaucracy was well known.  When required to write a five-year plan for CDC, he wrote: “Five year goal: Build the biggest computer in the world. One year goal: Achieve one-fifth of the above.” Building the CDC 6600 was a project for CDC, although a high risk project. Seymour Cray and his team had all the resources that they needed.

This post is about governance for analytic and AI projects.  Unless you have a Seymour Cray and a small team that has all the resources that you need, analytic governance is often what determines whether your analytic project will succeed.

In particular, analytic governance often determines whether your analytics project gets the data it needs, whether the analytic model you develop is biased, whether the model gets deployed, whether the project that you are working on delivers the business value it promised, and whether the business value gets recognized.

First, let’s define analytic governance.  A standard definition of IT governance is [3]:

  1. Ensure that the investments in IT generate business value.
  2. Mitigate the risks that are associated with IT.
  3. Operate in such a way as to make good long-term decisions with accountability and traceability to those funding IT resources, those developing and support IT resources, and those using IT resources.

We could simply replace IT with analytics to get a definition of analytic governance.  On the other hand, I have found in my experience that in practice it is quite useful to add one more component to the definition.  As we have discussed several times on this blog, a useful tool for implementing analytics in a company or organization is the analytic diamond, which provides a framework for integrating analytic infrastructure, analytic modeling, analytic operations, and analytic strategy.  For this reason, we use the following definition of analytic governance [4]:

  1. Ensure that good long-term decisions about analytics are reached and that investments in analytics generate business value.
  2. Manage the risk and liability associated with data & analytics.
  3. Operate in such a way as to make sure that there is accountability, transparency, and traceability to those funding analytic resources, to those developing and supporting analytic resources, and to those using analytic resources.
  4. Provide an organizational structure to ensure that the necessary analytic resources are available, that data is available to those building analytic models, that analytic models can be deployed, and that the impact of analytic models is quantified and tracked.

At the minimum, the analytic governance structure at most companies should include the following:

  1. Analytic Governance Committee of senior stakeholders
  2. An Analytics Technical Policy Committee of those involved in developing technical policies
  3. An Analytics Security and Compliance Committee of those involved in security and compliance for analytics projects

In addition, if there is not already a data committee and/or a data quality committee that is part of the IT governance structure, then this should be added also.  Also, some companies would benefit from a cloud computing committee depending upon where they are in leverage commercial cloud computing service providers.

You can find more about analytic governance in my forthcoming book the Strategy and Practice of Analytics, and a bit about it in my primer: Developing an AI Strategy: A Primer.

I’ll be giving a talk about analytic governance at The Data Science Conference (TDSC) that will be taking place on May 18, 2020.  Normally, the conference was planned to be held at the Gleacher Center in Chicago, but this year due to the stay at home order, it will be a virtual event.

References

[1] Phil Goldstein, How the IBM 7094 Gave NASA and the Air Force Computing Superiority in the 1960s, FedTech, https://fedtechmagazine.com/article/2016/10/how-ibm-7094-gave-nasa-and-air-force-computing-superiority-1960s

[2]  Toby Howard, Seymour Cray: An Appreciation, http://www.cs.man.ac.uk/~toby/writing/PCW/cray.htm. This article also appeared in Personal Computer World magazine, February 1997.

[3] Allen E Brown and Gerald G Grant. Framing the frameworks: A review of IT governance research. Communications of the Association for Information Systems, 15(1):38, 2005.  Available at: https://aisel.aisnet.org/cais/vol15/iss1/38/

[4] Robert L. Grossman, Developing an AI strategy: A Primer, Open Data Press, 2020, available online at analyticstrategy.com

The image of the CDC 6600 is by Jitze Couperus, Flickr: Supercomputer – The Beginnings, (License: CC Attribution 2.0 Generic).  Also https://en.wikipedia.org/wiki/File:CDC_6600.jc.jpg

Filed Under: Uncategorized Tagged With: analytics governance, CDC 6600, IBM 7094, IT Governance, Seymour Cray

Scores, Actions & Measures and COVID-19 SIR Models and Interventions

March 12, 2020 by Robert Grossman

Source: Alissa Eckert, MS, Dan Higgins, MAMS.

An important tool for analytic operations is the SAM framework, which is an abbreviation for scores, actions and measures. For the purposes here, think of analytic models as a black box that takes data records as inputs and produces scores as outputs.

For example, a model in computational advertising takes information about a visitor to a website as input and produces scores about ads as outputs so that ad server can decide which ads to offer the visitor (the higher the score the more likely the visitor is to click on it). Here the action is which ad to display to the visitor. There are several common ways to measure the effectiveness of the model. One is the cost per click (CPC), which is the amount spent on ads during a time period, divided by the number of clicks during the period. Another commons measure is the cost per acquisition, which requires the definition of an acquisition, such as filling out a form or buying a product. The cost per acquisition is then the amount spent on ads during a time period divided by the number of acquisition events.

SAM. The SAM framework shifts the attention from the performance of the model, as measured, for example, by the accuracy and false detection of the model, to the actions that you are trying to achieve and the relevant measures:

The SAM framework is covered in Chapter 9 of my forthcoming book The Strategy and Practice of Analytics (SPA). A slightly more general variant of SAM is to think of models as producing scores as well as other outputs and for the SAM framework to use these outputs to decide upon actions. Examples of other outputs include confidence scores and reason codes. In both cases, whether using just scores or score and other outputs to select appropriate actions, measures are used to quantify the value of the actions selected. Once measures are defined, standard techniques in optimizations can be used to choose actions that minimize or maximize the corresponding value as required.

COVID-19 SIR Models. Let’s turn now into COVID-19 epidemiological models.

One of the most basic epidemiological models for modeling COVID-19 is the SIR model, which models the number of susceptible S(t), infected I(t), and recovered (or removed) individuals R(t) in a population for each day t. For those that remember a bit of college calculus, there is a very readable introduction to the SIR model provided without a paywall by the MAA. The output of the SIR model are three curves that

When applying the SAM framework to COVID-19 modeling, the inputs can be viewed as the vector of parameters defining the model and the outputs as the number of infected individuals on a particular day t or the total number of infected individuals over a period of days. The actions might be interventions, such as sheltering in place, everyone wearing face masks, or other such measures. The measures might be the decrease in infections resulting from the interventions, or the decrease in deaths.

One of the more comprehensive studies of interventions for COVID-19 is the March 16, 2020 study by Imperial College COVID-19 Response Team.

To summarize, when we view COVID-19 modeling from a SAM point of view, the scores are the predictions of the SIR models as usual, while the actions are mitigations, and the measures are the number of infected individuals or the number of deaths that result from the mitigations. As is often the case, choosing appropriate actions is an optimization problem and requires an algorithm or model on its own.

Filed Under: Uncategorized Tagged With: COVID-19, interventions, mitigations, SAM, scores actions and measures, SIR model

Machine Learning Bias – A Very Short History

February 10, 2020 by Robert Grossman

Protecting against both implicit and explicit bias as always been an important aspect of deploying machine learning models in regulated industries, such as credit scores under the Fair Credit Reporting Act (FCRA) and insurance underwriting models under the requirements of state regulators. 

Over the last few years, there has been a lot surprise about how easy it is for bias to become part of large learning datasets used in transfer learning, such as imageNet, and for bias to influence machine learning systems that are not carefully built or adequately tested.

In part, this is because machine learning and deep learning frameworks, such as TensorFlow, PyTorch and Keras, make it quite easy to develop a model, without understanding how the model works internally, and do not provide tools for testing against bias.

For historical context, it is useful to look at the language in the FCRA (Section 1002.2(p)(1)) that was originally passed in 1970, about fifty years ago.

(1) A credit scoring system is a system that evaluates an applicant’s creditworthiness mechanically, based on key attributes of the applicant and aspects of the transaction, and that determines, alone or in conjunction with an evaluation of additional information about the applicant, whether an applicant is deemed creditworthy. To qualify as an empirically derived, demonstrably and statistically sound, credit scoring system, the system must be:

(i) Based on data that are derived from an empirical comparison of sample groups or the population of creditworthy and non-creditworthy applicants who applied for credit within a reasonable preceding period of time;

(ii) Developed for the purpose of evaluating the creditworthiness of applicants with respect to the legitimate business interests of the creditor utilizing the system (including, but not limited to, minimizing bad debt losses and operating expenses in accordance with the creditor’s business judgment);

(iii) Developed and validated using accepted statistical principles and methodology; and

(iv) Periodically revalidated by the use of appropriate statistical principles and methodology and adjusted as necessary to maintain predictive ability.

The FCRA is enforced by the Federal Trade Commission and the Consumer Financial Protection Bureau. (The seal of the Consumer Financial Protection Bureau is at the top of this post.)

The key words italicized here, and in the FCRA itself, are: “empirically derived, demonstrably and statistically sound.” A good way of thinking of this is that if there are two subpopulations each with a variable at certain incidence level, say defaulting on credit card payments, and a model (say a default model) that is predicting this variable from certain features, then in general, the predicted incidence level of this variable should approximately match the natural incidence level of this variable.

As a simplified example, if males between 25-35 years of age that are currently employed and have been employed continuously for at least 3 years have a credit card default rate of 3.25% and your predictive model adds a zip+4 feature to predict default rates (something that should not be done in a credit or default model), you might be inadvertently introducing a bias in the model due to correlations between zip+4 and certain factors that should not be used as features in credit or default models. For this reason, usually just the first three digits of a zip code are used as a feature in credit or default model.

Bias comes into all machine learning in various ways:

  1. Labeled training data can be biased for the simple reason that is labeled by individuals with either implicit or explicit biases. 
  2. Training data can be biased because it comes from systems that are not used by individuals from all social-economic, ethnic or other groups that the system may be applied to in the future.  For example, facial analysis system often have higher error rates for minorities due to unrepresentative training data, for example.
  3. Biases may be presented in components of an algorithm, for example from a general transfer learning dataset from a third party that is used in a deep learning model prior to using data for the specific model being developed.

On the other hand, systems that use machine learning have some important advantages compared to manual systems:

  1. They are process data automatically and uniformly and do not reflect prejudices of humans.  As an example, credit based on machine learning provided credit to many who were previously “red-lined” and denied credit.
  2. Algorithms can be examined for biases. 

There is an increasing amount of information about best practices for building machine learning and AI models that identify and work to eliminate implicit and explicit biases. Some standard advice for guarding against biases in machine learning that is adapted from Google’s Inclusive ML Guide [https://cloud.google.com/inclusive-ml/] includes

  1. Design your model from the start with concrete goals for fairness
  2. Use representative datasets to train and test any systems
  3. Check the system for unfair biases
  4. Analyze performance

Filed Under: Uncategorized Tagged With: credit score, deep learning bias, fair models, FCRA, machine learning bias

  • « Go to Previous Page
  • Page 1
  • Interim pages omitted …
  • Page 5
  • Page 6
  • Page 7
  • Page 8
  • Page 9
  • Go to Next Page »

Primary Sidebar

Recent Posts

  • Developing an AI Strategy: Four Points of View
  • Ten Books to Motivate and Jump-Start Your AI Strategy
  • A Rubric for Evaluating New Projects that Produce Data
  • How Does No-Code Impact Your Analytic Strategy?
  • The Different Varieties of Advisors & the Difference it Makes

Recent Comments

    Archives

    • May 2022
    • April 2022
    • March 2022
    • February 2022
    • January 2022
    • December 2021
    • November 2021
    • October 2021
    • September 2021
    • August 2021
    • July 2021
    • June 2021
    • May 2021
    • April 2021
    • March 2021
    • February 2021
    • January 2021
    • December 2020
    • November 2020
    • October 2020
    • September 2020
    • August 2020
    • July 2020
    • June 2020
    • May 2020
    • April 2020
    • March 2020
    • February 2020
    • January 2020
    • December 2019
    • November 2019
    • October 2019
    • September 2019
    • June 2019
    • May 2019
    • September 2018

    Categories

    • Uncategorized

    Meta

    • Log in
    • Entries feed
    • Comments feed
    • WordPress.org

    Copyright © 2025