• Skip to primary navigation
  • Skip to main content
  • Skip to primary sidebar
Analytic Strategy Partners

Analytic Strategy Partners

Improve your analytic operations and refine your analytic strategy

  • Home
  • Blog
  • Books
  • About
  • Services
  • Contact Us

Robert Grossman

Do You Need a Grand Strategy in Analytics?

September 10, 2020 by Robert Grossman

Figure 1: From lean to grand analytic strategies.

In foreign affairs and national defense, especially among academics, it has becoming more common to talk about grand strategies. There is a very popular course at Yale University by John Lewis Gaddis called On Grand Strategy, and in 2018 he published a book worth reading with the same name.

An emerging definition for grand strategy for state is “something that has the characteristics of being long-term in scope, related to the state’s highest priorities, and concerned with all spheres of statecraft (military, diplomatic, and economic) [Silove 2018].” Of course, the problem is that a strategy in general is concerned with the long term decisions that an organization makes to further its priorities, so this definition doesn’t help as much as you might hope. See the Appendix for a definition of analytic strategy.

There is though some common themes that emerge if you review some of the recent articles on grand strategies [Biddle 2015, Silove 2018; Gaddis 2018]:

  • Grand strategies are longer term than typical organizational strategies, for example, 20 or more years. Fifty and hundred strategies are not unusual in China.
  • Grand strategies cover more domains than typical organizational strategies. For example, grand strategies for states typically cover military, diplomatic and economic strategies, and not just one of these.

At the Other Extreme – A Lean Analytic Strategy

Before discussing grand analytic strategies, it is probably helpful to start at the other extreme (see Figure 1) and briefly mention lean analytic strategies. In the post, I discuss developing a lean analytic strategy and introduced a lean analytic canvas modeled after the business model canvas for lean start-ups. For start-ups, smaller companies, and smaller units in larger organizations, the focus should be on developing an end to end system with analytics that some value as soon as possible, and iteratively improving it to increase the business value that it delivers. A lean analytic strategy is a good way to do this. You can find more information in Chapter 10 of my book: Developing an AI Strategy: A Primer and a definition of a lean analytic strategy in the Appendix of this post.

Five Questions for a Grand Analytic Strategy

At the other extreme, for larger organizations with multiple divisions and planning that extends out five years or more, it may be appropriate to consider developing a grand strategy for analytics that includes answering questions like the following?

  1. In the long run, how much of the IT, data and analytic ecosystem do we buy vs build? What new technologies should we develop to advance our strategy in analytics?
  2. What are our long terms alliances and partnerships in analytics?
  3. How can we develop, promote and influence standards in analytics to support our strategy in analytics?
  4. How can we best leverage lobbying and influence legislation to support our long term strategy in analytics?
  5. How can we educate our users in particular and the public more generally so that they understand and support how we use data and analytics in our products and services, while balancing privacy with improved functionality?

An Example – Google’s Grand Strategy in Analytics

Alphabet’s revenues for 2019 were over $161 billion and leveraged their analytics and AI to drive revenue across the various subsidiaries of Alphabet and and divisions of Google and leverages advances resulting from investments in fundamental computing and analytics over years. The second paragraph of Alphabet’s fourth quarter 2019 earnings release [Alphabet 2020] reads:

Our investments in deep computer science, including artificial intelligence, ambient computing and cloud computing, provide a strong base for continued growth and new opportunities across Alphabet.

Source: Alphabet 2020.

A recent report from CBInsights writes:

[Google] is also seeking out new streams of revenue in sectors with large addressable markets, namely on the enterprise side with cloud computing and services. Furthermore, it’s looking at industries ripe for disruption, such as transportation, logistics, and healthcare. Unifying Alphabet’s approach across initiatives is its expertise in AI and machine learning, which the company believes will help it become an all-encompassing service for both consumers and enterprises.

Source: CBInsights, Google Strategy Teardown, 2020.

From Lean to Grand Analytic Strategies

To summarize, as Figure 1 shows, there is a spectrum of analytic strategies, as the complexity of the organization grows and as the time frame of interest lengthens. As you move from left to right in the figure, the scope of the strategy becomes broader and broader.

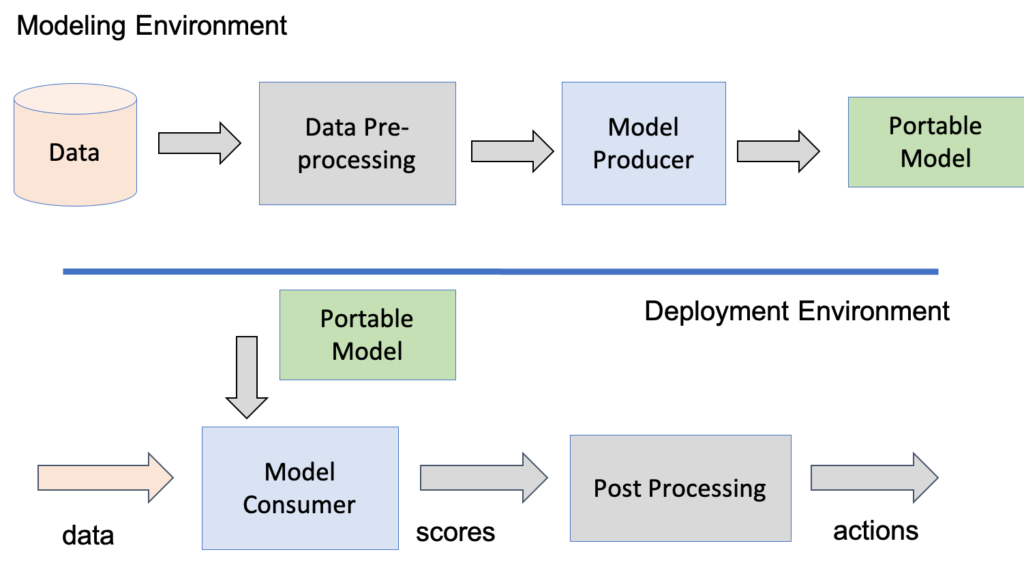
A lean analytic strategy is a shorter term strategy for an analytic start-up or a smaller unit within a large organization, and is concerned with the core of any analytic strategy: how data is collected or generated; how data is transformed using analytics to produce scores or other outputs; how the outputs are used to create something that can be monetized or something that otherwise brings value to the business; and how this whole chain can be protected from a competitive standpoint.

An analytic strategy specifies the long-term decisions an organization makes about how it uses its data to take actions that satisfy its organizational vision and mission; specifically, the selection of analytic opportunities by an organization and the integration of its analytic operations, analytic infrastructure, and analytic models to achieve its mission and vision.

A corporate analytic strategy is an analytic strategy for two or more strategic business units, and it includes a plan for allocating resources across the business units.

A grand analytic strategy is longer term in scope than a typical analytic strategy and is designed for large complex organizations with various subsidiaries, divisions, or strategic business units. A grand analytic strategy is concerned with all spheres and interactions of the organization with analytics, both internal and external, including the broader technological landscape, regulatory and legal landscape, public perceptions, societal trends, etc. around analytics and its applications.

For more information, see: Developing an AI Strategy: A Primer.

References

[Alphabet 2020] Alphabet Announces Fourth Quarter and Fiscal Year 2019 Results, retrieved from https://abc.xyz/investor/static/pdf/2019Q4_alphabet_earnings_release.pdf, on November 1, 2020.

[Biddle 2015] Tami Davis Biddle, Strategy and grand strategy: What students and practitioners need to know. Army War College-Strategic Studies Institute, Carlisle, United States; 2015 Dec 1.

[CBInsights 2020] CBInsights, Google Strategy Teardown, 2020.

[Gaddis 2019] John Lewis Gaddis. On grand strategy. Penguin Books, 2019.

[Silove 2018] Nina Silove, Beyond the Buzzword: The Three Meanings of “Grand Strategy”, Security Studies, 27:1, 27-57, 2018, DOI: 10.1080/09636412.2017.1360073

Notes About Links

There are no affiliate links in this post and I get no revenue from the Amazon links. I do get a royalty from the sale of the book Developing an AI Strategy: A Primer.

Filed Under: Uncategorized Tagged With: AI, analytic strategy, analytics, grand analytics strategy, grand strategies, grand strategy, lean analytics

When You Need to Deploy Predictive Models Safely

August 10, 2020 by Robert Grossman

Little languages. A key insight in the development of Unix was that there was an important role for what became known as little languages, which are simple specialized languages for executing important types of tasks. The insight was that it is much easier to design a little language that can be implemented efficiently for a specific task than a general language that is designed to support all tasks. For example, in Unix there are specialized little languages and corresponding programs for:

  • pattern matching (regular expressions)
  • text line editing (ed/sed)
  • grammars for languages (lex/yacc)
  • shell services (sh)
  • text formatting (troff/nroff)
  • processing data records (awk)
  • processing data (S)

This point of view is explained clearly in an influential 1986 ACM article by Jon Bentley called Little Languages. Of course, on the downside is that software developers must learn the little languages.

How should we view models in analytics, AI and data science? From the viewpoint of the practice of analytics, it is important to understand the different perspectives that different members in your organization have about analytic models.

  • If you are a modeler, your task is often given some data to develop an analytic model. So your input is data and your output is an analytic model. Historically, modelers split data into training and test (or validation), but these days with hyper-parameters it’s more common to split into training, dev and test datasets.
  • If you are a member of an operations team (what I call analyticOps) that is deploying analytic models in products, services or internal operations, than you must manage multiple analytic models and make sure that they are processing data as required to produce scores and that the associated post-processing is in place to process the scores and take the required actions.
  • If you are a member of the IT team, or the IT team deploying analytic models, such as the AIOps or ModelOps team, then you task is to take the models developed by the modeling team, manage them as enterprise IT assets, and deploy them as needed into the required products, services and internal processes.
  • Finally, if you are developing an analytic strategy, then the models produced by the modeling team and the products, services and internal processes managed by the analytic operations team are part of a broader analytic ecosystem that might also include supply chain partners and product ecosystem partners that also use models that your organization develops.

With this split (described in more detail in my post on the analytic diamond) and in my primer Developing an AI Strategy, a Primer, there is one team that produces models and one or more teams that consumes models, and so it is natural to ask what type of efficiencies can be obtained by using little languages for expressing models and using these little languages for managing models across an analytic enterprise and the analytic ecosystem that it supports, including all the applications and systems that produce models (model producers) and all the applications and systems that consume models (model consumers).

Analytic models as code. With the critical importance of DevOps, there is another important way to view models. With this view, models are simply code, and the way to manage code is with a version control system, continuous integration (CI), and continuous deployment (CD). Model code is dockerized in a container, and the dockerized container is managed with the same systems that are used for the CI/CD of the rest of the code. There are many more software developers than modelers, and so the most common way of viewing analytic models these days is as code.

Analytic models as described in little languages. Returning to the first point of view, there are several little languages that have been developed for analytic models:

  • Predictive Model Markup Language (PMML). PMML is an XML language for expressing standard statistical, machine learning and data mining models, that has been used for over 20 years. It is widely deployed, and good at expressing the familiar machine learning models, such as decision trees, support vector machines and clusters, but does not support arbitrary models and has only a limited ability to support the data transformations that are needed for preparing features for models.
  • Open Neural Network Exchange (ONNX). ONNX is a language for expressing deep learning neural network models and is supported by major systems for deep learning including TensorFlow, PyTorch and Keras. It is by far the most common language for expressing deep neural networks, but does not support standard statistical and data mining models as well, and also does not fully support data transformations that are often required in machine learning and analytics.
  • Portable Format for Analytics (PFA). The Portable Format for Analytics is a newer little language and model interchange format for analytic models based upon JSON that is designed for the safe and secure execution of arbitrary analytic models and arbitrary data transformation. You can find an overview of PFA that was presented at KDD 2016 that also describes an open source PFA scoring engine. PFA supports the safe and secure execution of models in several ways, including:
    • PFA models are strictly sandboxed
    • PFA models can only access data that is explicitly given to it
    • PFA models cannot manipulate anything beyond its own state
    • PFA models have no way to access the disk, network or operating system
    • PFA models have static data types and missing value safety
  • Combinations of little languages. In some situations, it might make sense to complement ONNX with PFA to support the data transformation not available, or not available efficiently in ONNX, and to support models that are not available in ONNX.

When you need to deploy models safely. There are some situations when it is critical to deploy code safely. It is well known that changing just a single line of code can bring down an enterprise system and for this reason there is always a risk in deploying analytic models as code in system that requires high availability with accurate results. As another example, when analytic models are deployed at the edges, including IoT, OT and in consumer devices, there are strong arguments for deploying models in safe languages, such as PFA, or other small languages designed for this purpose.

References

[1] Bentley J. Programming pearls: little languages. Communications of the ACM. 1986 Aug 1;29(8):711-21.

[2] Pivarski J, Bennett C, Grossman RL. Deploying analytics with the portable format for analytics (PFA). In Proceedings of the 22nd ACM SIGKDD International Conference on Knowledge Discovery and Data Mining 2016 Aug 13 (pp. 579-588).

Filed Under: Uncategorized Tagged With: AIOps, analytic ecosystem, analytic models, analytic models at the edge, analytic operations, AnalyticOps, little languages, ModelOps, ONNX, PFA, PMML, safe execution

Continuous Improvement, Innovation and Disruption in AI

July 6, 2020 by Robert Grossman

Figure 1. Some of the differences between continuous improvement and innovation in analytics and AI.

It’s important for managers and leaders in analytics and AI to know the difference between continuous improvement, innovation and disruption in their field and to know how it applies to their projects and to their organization.

Continuous improvement is about encouraging, capturing and using individual knowledge about current processes and how to improve them from the people actively involved. Good examples of continuous improvement applied to complex engineering problems includes: W. Edwards Deming improving the quality of automobile manufacturing in Japan (the Kaizen Process); Bill Smith at Motorola trying to reduce the defects in the manufacturing of computer chips (leading to Six Sigma); and Admiral Hyman G. Rickover improving the safety of nuclear reactors on nuclear submarines [1].

Innovation is about developing new processes, products, methodologies, and technologies. It is usually done by those not directly involved in the day to day to work. Often there is a challenge transitioning innovations from the lab to a product or into a deployed process in production. These days, it’s claimed more than it’s produced. True innovations are usually recognized by experts relatively quickly, but by others over a longer period of time due to clutter in the markets [2, Chapter 3]. Also innovative technology can take a while for companies to deploy for a variety of reasons, including the agility of the company, the lock-in of current vendors, and the sometimes complex motivations and incentives of decision makers [2, Chapter 4].

Disruption occurs when a new technology fundamentally alters the price-benefit structure in an industry or market segment [3]. An example from AI is the use of deep learning software frameworks, such as TensorFlow and PyTorch, along with transfer learning from large pre-trained models, such as ImageNet, Inception, and ResNet, which allows individual scientists using modest computational resources to build deep learning models, without the large computational infrastructure and very large datasets that would be required otherwise.

Some differences

Continuous improvement is about improving something that exists. Innovation is about creating something that doesn’t exist. Innovation can take months or years, while continuous improvement can often be done in days or weeks. See Figure 1 for some more differences.

Best practices in analytics

Best practices for continuous improvements in analytics include:

  • A champion-challenger methodology, where you use a formal methodology to frequently new models and compare them using agreed upon metrics to the current model in production.
  • Weekly model reviews, where all the stakeholders meet each week to review the model’s performance, what additional data can be added to the model, the actions associated with the model, and business value generated from the actions and discuss how these can be improved. Weekly model reviews are part of the Model Deployment Review Framework that I cover in my upcoming book, the Strategy and Practice of Analytics.
  • Model deployment frameworks. A third best practice is to use a model deployment framework so that models can be deployed quickly into production. This might involve PMML or PFA , a DevOps approach to model deployment, or one of the providers of specialized software in this area.

Best practices for supporting the development of innovation in analytics include:

  • Setting up a structure to develop innovative projects. This can be a separate group (a R&D lab, a Future Groups, or an Innovation Center) or supporting regular time (such as Google’s 20% time) devoted to innovation. For example, in our Center we set aside 1-3 days per month for the entire team to work on selected projects that have been proposed.
  • Setting a process to select and support meritorious projects. Innovation takes times and requires support. It cannot be done in a simple brain-storming session.
  • Setting up and fine tuning a process to move useful innovations from the lab into practice. Finally, it is all too common for innovation in large organization never to leave the lab. A number of large organizations have over time developed good processes for transitioning innovation to create new products, services and processes. IBM is quite good at this [3]; a recent example is the investment they put into bringing holomorphic encryption into practice, which took sustained investment over more than a decade. Overtime, this will have an important impact on analytics and AI.

The Power of Simple Process Improvements

It is worth emphasizing the tremendous power of simple process improvements, such as transitioning from letting the data scientists that build models decide when and how to deploy them to weekly model reviews involving all stakeholders, including the business owners. In these weekly meetings, the model is reviewed end-to-end, including the data available, the performance of new models (the challenger in the champion-challenger methodology), and discussing developing potentially new actions associated with the model (see the post on Scores, Actions and Measures (SAM)).

Here is another simple example of the power of continuous improvement that is not related to analytics. For many years, I took notes using emacs in outline mode. Recently, after reading about the Zettelkasten method, I switched to using emacs in org mode and adopted a few of the ideas used in digital Zettelkasten. This small change has made it much easier for me to find technical information that I need. You can find a nice introduction to Zettelkasten in lesswrong.

References

[1] Dave Oliver, Against the Tide: Rickover’s Leadership Principles and the Rise of the Nuclear Navy. Naval Institute Press, 2014.

[2] Robert L. Grossman, The structure of digital computing: from mainframes to big data, Open Data Press, 2012. See Chapter 3, Technical Innovation vs. Market Clutter and Chapter 4, Technology Adoption Cycles. Also available from Amazon.

[3] Clayton M. Christensen, The innovator’s dilemma: when new technologies cause great firms to fail, Harvard Business Review Press, 2013.

[4] National Research Council. 1995. Research Restructuring and Assessment: Can We Apply the Corporate Experience to Government Agencies?. Washington, DC: The National Academies Press. https://doi.org/10.17226/9205. See https://www.nap.edu/read/9205/chapter/6.

Filed Under: Uncategorized Tagged With: AI, analytics, continuous improvement, data science, disuption, innovation, kaizen, six-sigma

Starting a Lean Analytic Start-Up: Four Key Questions to Ask

June 7, 2020 by Robert Grossman

“Success is the ability to go from one failure to another with no loss of enthusiasm.”
Traditional.

Figure 1. An analytic business model canvas.

A popular tool for lean start-ups is the business model canvas. This is an example of one of my favorite things: a one-pager. A one-pager is the distillation of a complex problem, project or issue into one page. Just as important as the output (the one-page summary) is the process that produced it. It’s rare that you don’t move at least a bit ahead by thinking through and writing a one page summary of a complex challenge or problem. One pagers are helpful in many situations. One of my favorite examples is a memo by Winston Churchill written on August 9, 1940 in the midst of the Battle of Britain requesting brevity in all papers and correspondence sent to him [1]: a plea for one-pagers (or less). See Figure 3.

In this post, we will look at a useful one pager for lean analytic start-ups.

The four principles of lean start-ups advocated by Eric Ries in his best selling book The Lean Startup [3] apply without change to analytic start-ups.

  1. Principle 1: Eliminate uncertainty and waste. This principle reminds us of the importance in a lean start-up of focusing on learning about your customers and learning about your potential market, and using that information to improve your product-market fit in an iterative fashion.
  2. Principle 2: Work towards a sustainable business model. This principle directly addresses finding a viable and sustainable business model around the products and services being developed.
  3. Principle 3: Develop a MVP. This principle focuses on developing a minimum viable prototype to learn about how your customers actually use and benefit from your product. I follow others (for example Marty Cagan [4]) and prefer to call this a minimum viable prototype, not a minimum viable product.
  4. Principle 4: Validated learning. The focus with this principle is to develop and track measures that quantify your progress developing a product and finding the right market for it. As in the quote at the beginning, validated learning is a good way to move quickly from one (or more) failures to something that succeeds.

The business model canvas is a one-pager that was developed initially by Alexander Osterwalder in a blog post in 2005 and popularized through a number of activities and venues, including in a book by Osterwalder and Yves Pigneur in 2010 [5]. A good introduction to the business model canvas is a Harvard Business Review article by Steve Blank called “Why the Lean Start-Up Changes Everything” [6]. Figure 2 is a business model canvas.

Figure 2. A business model canvas.

A useful question to ask is what are the minimal changes that we can make in the business model canvas to create a business model canvas for a lean analytic start-up. One approach from [2, chapter 10] is shown in Figure 1. Here we make three changes from the standard business model canvas that we describe below.

First, we include the analytic value chain framework from [2] in the canvas. This focuses on four critical activities that provide the foundation for analytics within a company or organization:

  1. Collecting data. The effort required to get the data needed varies significantly depending upon the project, but is often one of the critical paths.
  2. Transforming data to create something of value to customers. This can be through analytic or AI modeling, or sometimes, just reformatting the data so that it provides more business value to your customers.
  3. Monetizing data. From a business model point of view, this is the core question. How to build an analytic product or service, find customers who are willing to pay for it, and develop a sustainable business model around it.
  4. Protecting your analytics from a competitive standpoint. There are many ways to establish a competitive advantage through analytics, but also many ways to lose it over time, especially as the number of tools and frameworks to build models and the availability of data to train them grows. It is important to think at the beginning how you might protect your analytic product or service over time.

It may be easier to remember this using the acronym (CTMP). Collecting and transforming data is the the core of an analytic business model, so I make it one of the three main vertical boxes in the canvas. For this reason, I relabeled the Revenue Streams box Monetize Data.

The CTMP Framework is a good way to structure four key questions as you think through your analytic start-up and the analytic business model canvas is a nice one-pager to help you visualize it.

I discuss the analytic value chain and the CTMP framework in Chapter 7 of my book: Developing an AI Strategy: a Primer [2]. Note that the analytic business model canvas covered in the book is slightly different than the one above.

The analytic business model canvas in Figure 1 also includes elements of the analytic diamond framework. The analytic diamond looks at data science, analytics, or AI projects from four viewpoints: analytic modeling, analytic operations (AnalyticOps), analytic infrastructure, and analytic strategy. In the analytic business model canvas, I include analytic strategy as a separate box. Analytic operations and analytic infrastructure fit naturally into the Key Activities box in the canvas. Analytic modeling is one of the main ways of transforming data, so it fits naturally into the Collect, Transform and Protect box.

Figure 3. A memorandum written by Winston Churchill in 1940 asking for brevity in reports [1]. Just one of many leaders that appreciate one-pagers to help make decisions about complex problems. Available without restrictions on use from: https://discovery.nationalarchives.gov.uk/

For more information

There is a lot of information on lean startup at the website theleanstartup and the book The Lean Startup is easy to read and inspiring.

Steve Blank’s website has a tremendous amount of useful and practical information about start-ups and entrepreneurship.

For more information about minimum viable prototypes, see Marty Cagan, Inspired: How to Create Tech Products Customers Love.

A popular and thoughtful biography of Winston Churchill is Andrew Robert’s Walking With Destiny. Richard Aldous has written a good review of the book in the New York Times Book Review called: “Is This the Best One-Volume Biography of Churchill Yet Written?”

The quote at the beginning is often misattributed to Winston Churchill, Abraham Lincoln and others, but its origin is hard to pin down its origin. See Appendix I: Red Herrings: False Attributions, Entry: Success is going from failure to failure without losing your enthusiasm, in Richard Langworth, Churchill By Himself: The Definitive Collection of Quotations, PublicAffairs, 2011, for a discussion about the attribution of the quote.

This post is based in part on Chapter 10 of Developing an AI Strategy: a Primer [2]. I cover the Analytic Diamond in Chapter 5 and the CMTP Framework in Chapter 7.

Disclosures

There are no affiliate links in this post, but I do make royalties from the sale of my book Developing an AI Strategy: a Primer.

References

[1] Winston S Churchill, Memorandum, August 9, 1940, Brevity, The National Archives CAB 67/8/11, https://discovery.nationalarchives.gov.uk/details/r/C9135954, accessed on July 10, 2020.

[2] Robert L. Grossman, Developing an AI Strategy: A Primer, Open Data Press, 2020.

[3] Eric Ries, The Lean Startup: How Today’s Entrepreneurs Use Continuous Innovation to Create Radically Successful Businesses Hardcover, Crown Business, 2011.

[4] Marty Cagan, Inspired: How to Create Tech Products Customers Love, Wiley, 2017.

[5] Alexander Osterwalder and Yves Pigneur. Business model generation: A handbook for visionaries, game changers, and challengers. John Wiley & Sons, 2010.

[6] Steve Blank. Why the lean start-up changes everything. Harvard Business Review, 2017.

Filed Under: Uncategorized Tagged With: analytic business model canvas, analytic diamond, analytic value chain, business model canvas, lean analytic startup, lean startup, minimum viable prototype, MVP

  • « Go to Previous Page
  • Page 1
  • Interim pages omitted …
  • Page 4
  • Page 5
  • Page 6
  • Page 7
  • Page 8
  • Page 9
  • Go to Next Page »

Primary Sidebar

Recent Posts

  • Developing an AI Strategy: Four Points of View
  • Ten Books to Motivate and Jump-Start Your AI Strategy
  • A Rubric for Evaluating New Projects that Produce Data
  • How Does No-Code Impact Your Analytic Strategy?
  • The Different Varieties of Advisors & the Difference it Makes

Recent Comments

    Archives

    • May 2022
    • April 2022
    • March 2022
    • February 2022
    • January 2022
    • December 2021
    • November 2021
    • October 2021
    • September 2021
    • August 2021
    • July 2021
    • June 2021
    • May 2021
    • April 2021
    • March 2021
    • February 2021
    • January 2021
    • December 2020
    • November 2020
    • October 2020
    • September 2020
    • August 2020
    • July 2020
    • June 2020
    • May 2020
    • April 2020
    • March 2020
    • February 2020
    • January 2020
    • December 2019
    • November 2019
    • October 2019
    • September 2019
    • June 2019
    • May 2019
    • September 2018

    Categories

    • Uncategorized

    Meta

    • Log in
    • Entries feed
    • Comments feed
    • WordPress.org

    Copyright © 2025